High-Net-Worth Asset Allocation: 2026 Benchmark Report
By Chris Bendtsen, Insights Lead
233 high-net-worth investors. $17M average net worth. 30+ charts examining allocation by wealth tier, age, wealth source, financial objective, advisor relationship, and risk tolerance.
Get the 2026 Asset Allocation Report
The 2026 High-Net-Worth Asset Allocation Report is Long Angle's fifth annual benchmark study, examining how high-net-worth investors allocate their wealth across asset classes. The report draws on 233 community respondents with an average net worth of $17M and a range from $2M to over $100M.
This year's findings show the traditional 60/40 portfolio is gone at this wealth tier, replaced by a 60-10-30 model. 94% of high-net-worth investors now hold private or alternative assets. Crypto adoption now exceeds private equity funds. And advisor AUM fees compress sharply with wealth, falling from 0.79% at $2M-$10M to 0.58% above $25M.
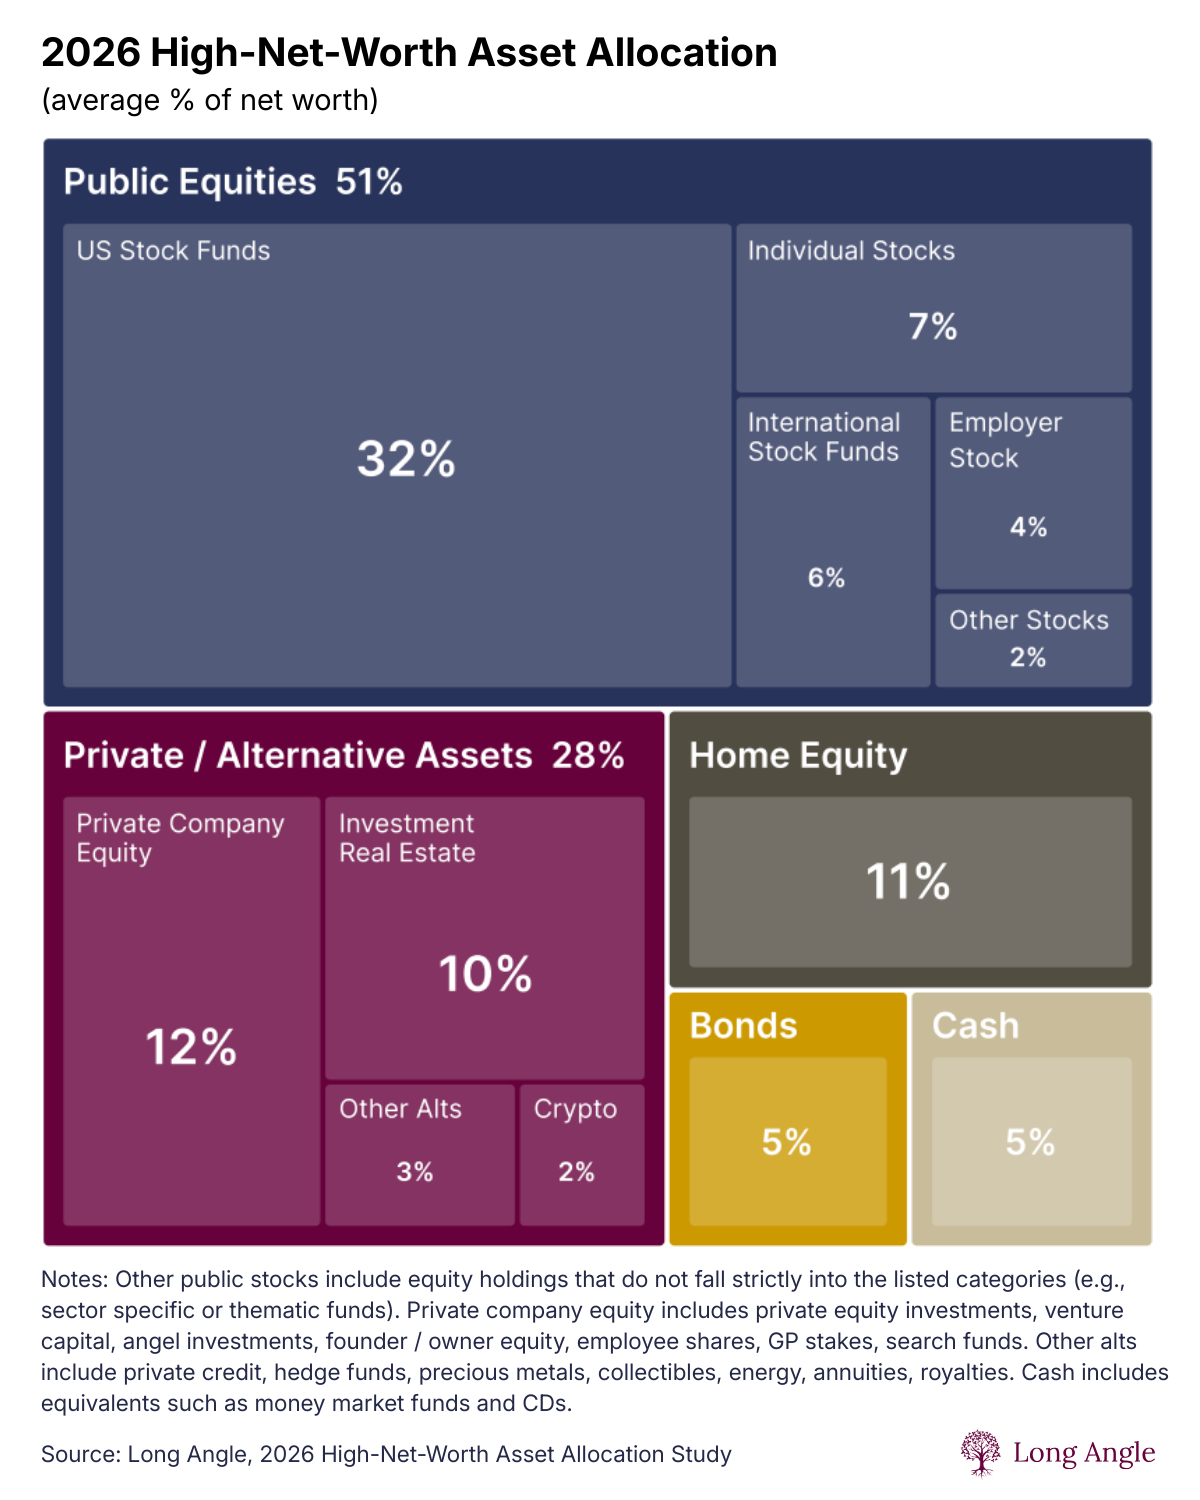
The average high-net-worth investor holds 51% of net worth in public equities, 28% in private and alternative assets, 11% in home equity, 5% in bonds, and 5% in cash, according to Long Angle's fifth annual report of 233 respondents with an average net worth of $17M. Private and alternative allocations rise from 24% at $2M-$10M to 34% above $25M.
Key Takeaways
Half of net worth in public stocks. The average high-net-worth investor holds 51% in public equities, with US stock funds alone representing 32% of total net worth.
9 in 10 invest in private and alternative assets. 94% of high-net-worth investors hold private companies, real estate, crypto, or related alternatives. The 60/40 portfolio is gone at this wealth tier.
60-10-30 portfolio. The traditional 60/40 has shifted to 60% public equities, 10% bonds and cash, 30% private and alternative investments, surpassing the industry's newer 50-30-20 model.
Crypto now exceeds private equity adoption. 42% of high-net-worth investors hold crypto. 39% hold private equity funds. Among investors under 40, crypto represents 15% of the private and alternative portfolio.
Advisor fees compress sharply with wealth. AUM fees scale from 0.79% at $2M-$10M to 0.67% at $10M-$25M to 0.58% above $25M.
Table of Contents
Methodology
The 2026 High-Net-Worth Asset Allocation Report is Long Angle's fifth annual benchmark study. The current edition was conducted between December 2025 and January 2026, featuring 233 respondents with an average net worth of $17M and a median above $10M.
All participants are members of Long Angle, a private community of over 8,000 successful entrepreneurs, executives, and investors. The respondent profile: 71% self-identify with high investment expertise, 79% are under the age of 55, 85% have over $5M in net worth, and 94% are based in the United States. Data was collected through detailed self-disclosures of asset allocations and liabilities. Net worth figures and allocation percentages were derived from this primary data, enabling cross-segmentation analysis by net worth tier, age, wealth source, financial objective, advisor relationship, and risk tolerance.
Asset Allocation by Net Worth
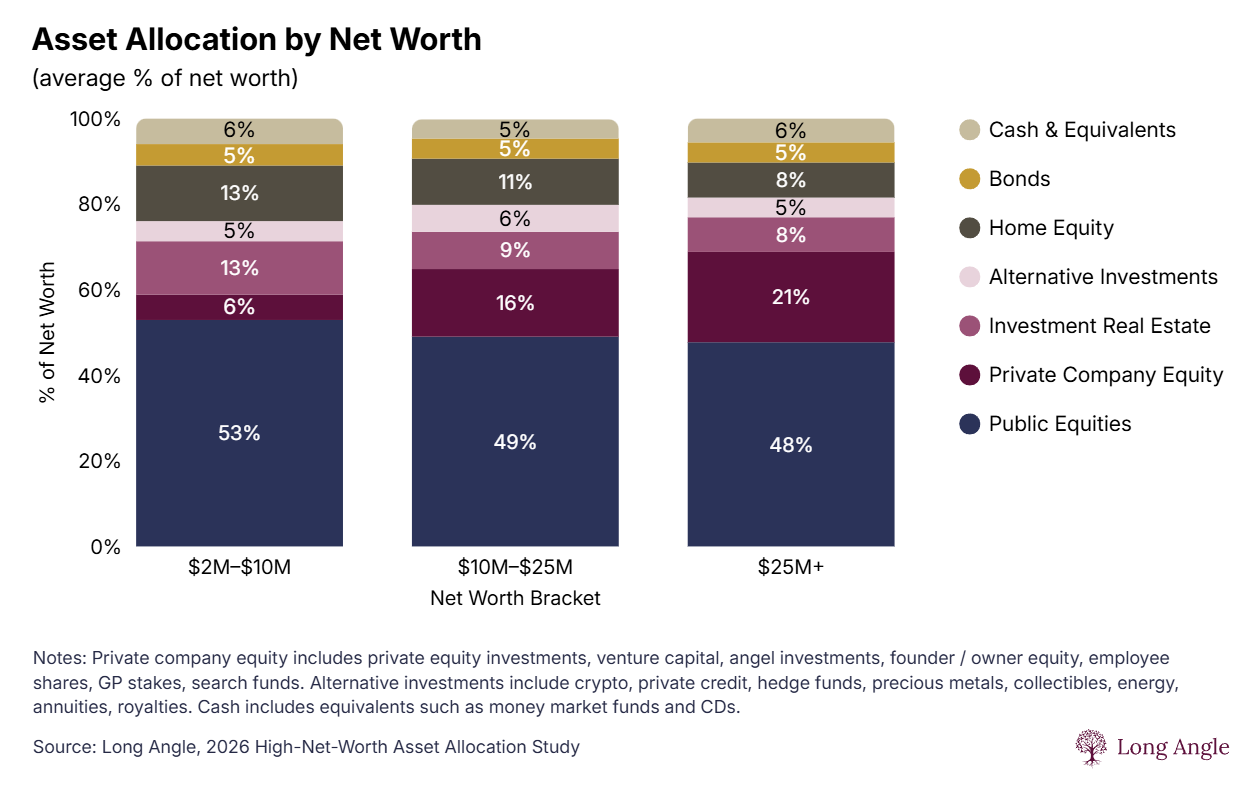
Over 90% of respondents invest in private or alternative assets. These allocations expand alongside net worth, rising from 24% in the $2M-$10M bracket to 31% at $10M-$25M to 34% for the $25M+ tier. The growth is driven by shifting priorities to private company equity.
As private allocations climb, they primarily displace public equities and home equity. While public stocks remain the largest single asset class, their share of net worth drops 5 percentage points from the first wealth tier to the last. Home equity falls by a similar percentage as the ratio of home value to net worth declines with increasing wealth. Allocations to bonds, cash, and alternative investments remain consistent regardless of total wealth.
Ultra-High-Net-Worth Asset Allocation
Ultra-high-net-worth investors above $25M allocate 21% of net worth to private company equity, more than triple the 6% share at the $2M-$10M tier. Public equities drop to 48%, investment real estate to 8%, and debt-to-assets ratio compresses to just 4%.
This shift reflects the concentration of founders, owners, and entrepreneurs at the $25M+ tier, many of whom hold significant equity in their own companies alongside their diversified investments. The average UHNW primary residence is valued at $3.33M with a 19% mortgage loan-to-value ratio. Average advisor AUM fees compress to 0.58%, the lowest tier in the study.
Want the full 233-respondent dataset?
High-Net-Worth Investment Portfolio
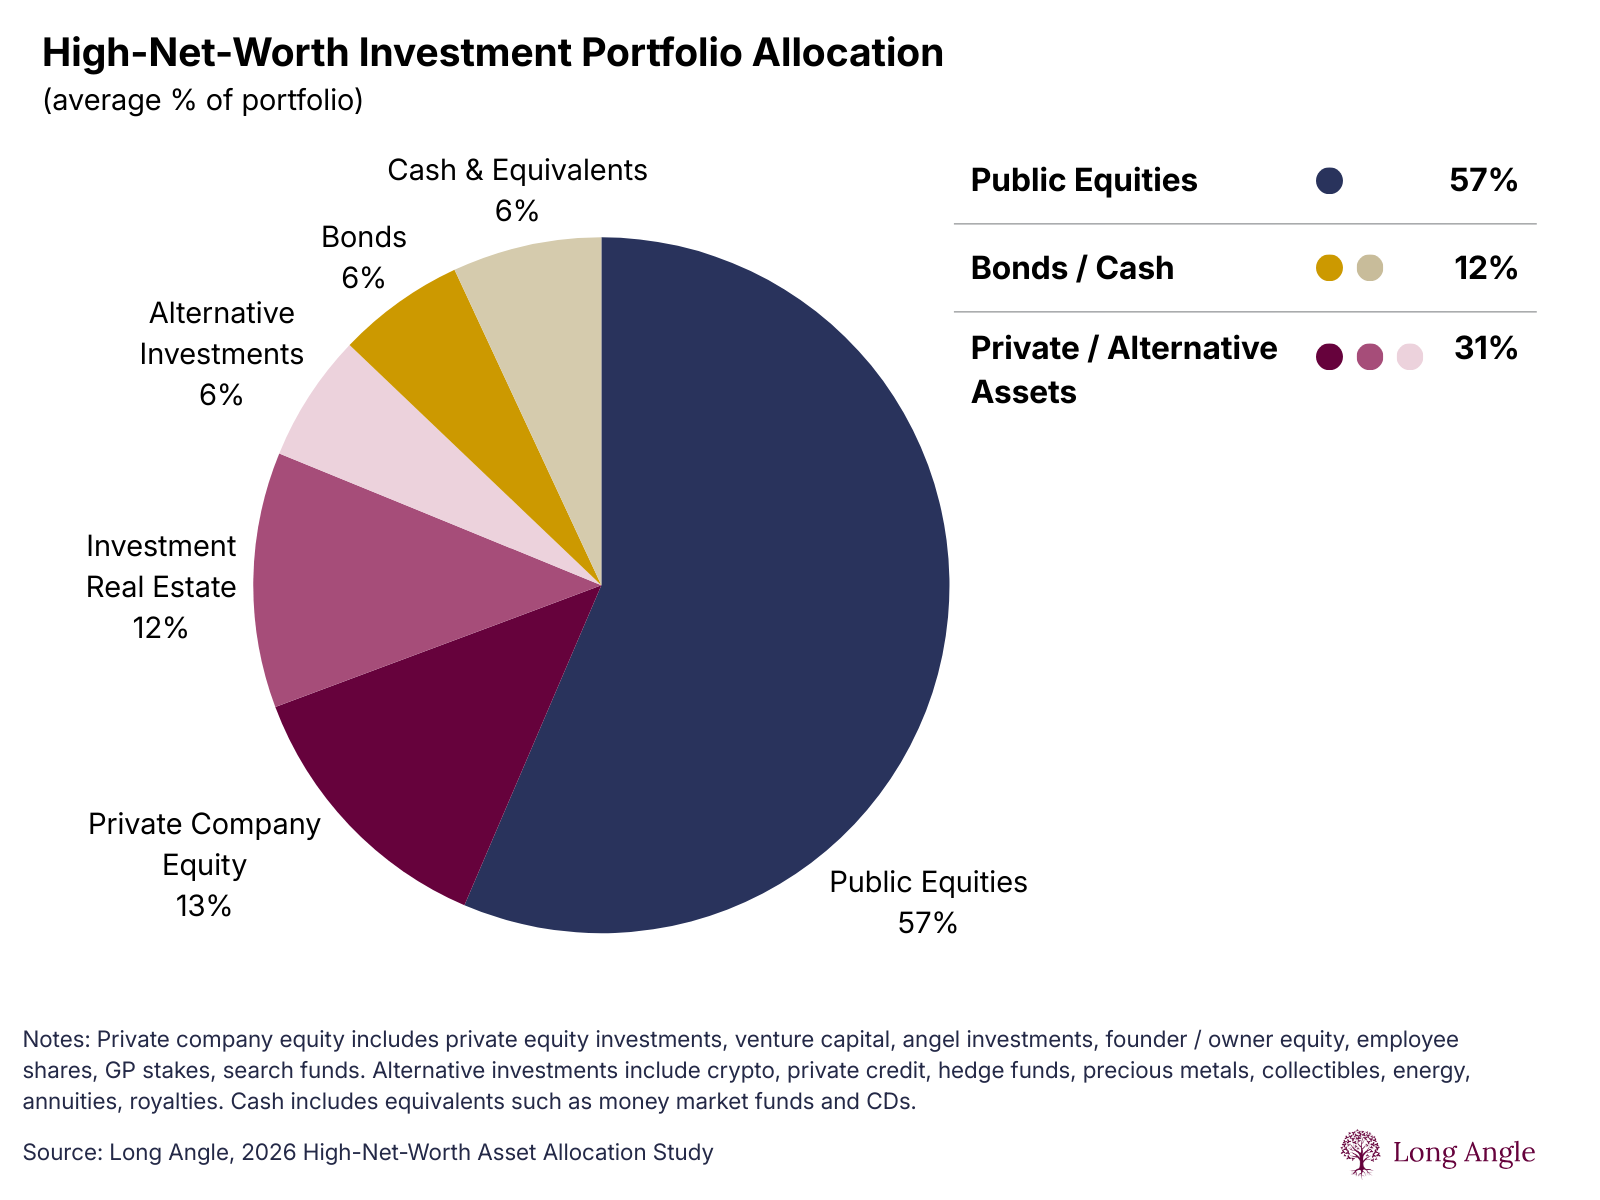
Excluding home equity, high-net-worth investors hold 57% in public equities, 31% in private and alternative assets, and 12% in bonds and cash. Within public equities, US stock funds dominate at 66% of the public equity portfolio, with international funds at 13%, individual stocks at 12%, employer stocks at 7%, and other public stocks at 3%.
This represents a clear shift from the traditional 60/40 portfolio. While recent industry attention has focused on a new 50-30-20 model, high-net-worth investors have already bypassed that benchmark by placing 31% of their portfolio into private markets and alternative investments.
Passive low-fee index funds are nearly universal: 91% of respondents hold them. Actively managed funds, in contrast, have fallen out of favor — used by only 33% of respondents. Direct indexing remains at 18% adoption despite its tax-loss harvesting advantages over traditional ETFs, suggesting a gap between strategy availability and uptake at this wealth tier.
Wealth Management Fees and Advisor Usage
57% of high-net-worth investors self-manage their portfolios. 43% use a financial advisor, RIA, or wealth manager, but only 14% have an advisor managing most or all of their assets. Half of all respondents have no interest in using an advisor at all.
Among the 43% who use an advisor, 71% pay AUM-based fees that average 0.70%. The fee distribution: 9% pay under 0.25%, 16% pay 0.25%-0.49%, 19% pay 0.50%-0.74%, 21% pay 0.75%-0.99%, and the most common single bracket is 1.00%-1.24% at 31%. Two-thirds of advised clients pay below 1%.
Advisor fees step down linearly across wealth brackets: 0.79% at $2M-$10M, 0.67% at $10M-$25M, and 0.58% above $25M. Advisor-led portfolios also allocate more to private company equity (18%) than self-managed portfolios (10%), with the difference fueled by greater PE investment access. The wealth management market is highly fragmented — no single firm holds more than a 10% share of advised respondents.
Diversification Strategies for High-Net-Worth Portfolios
High-net-worth diversification strategies cluster around three objectives: yield from real estate, upside from private equity and crypto, and uncorrelated returns from alternatives like hedge funds and precious metals.
The 2026 report surfaces five durable patterns:
Increased private market exposure. As net worth grows, investors shift allocations to private equity, venture capital, angel investments, and founder or employee equity for upside potential and capital appreciation.
Real estate as an income stream. Investment real estate concentrations rise among income-focused investors, who hold 20% in real estate versus 10% for growth-focused peers.
Minimal bond holdings. Fixed-income allocations remain low across the risk tolerance spectrum. Even low-to-moderate risk investors hold only 8% in bonds.
Crypto for asymmetric growth. The average crypto allocation now exceeds the allocation to precious metals by more than 2x and exceeds private equity fund adoption by 3 percentage points (42% vs 39%).
Alternative investments for uncorrelated returns. Investors hedge market volatility through hedge funds, private credit, precious metals, energy, royalties, and collectibles.
Long Angle's analysis of the current private credit environment provides additional context on the asset class. For investors evaluating tax treatment of private market allocations, see the K-1 guide.
See the full data behind these findings.
Private and Alternative Investment Portfolio
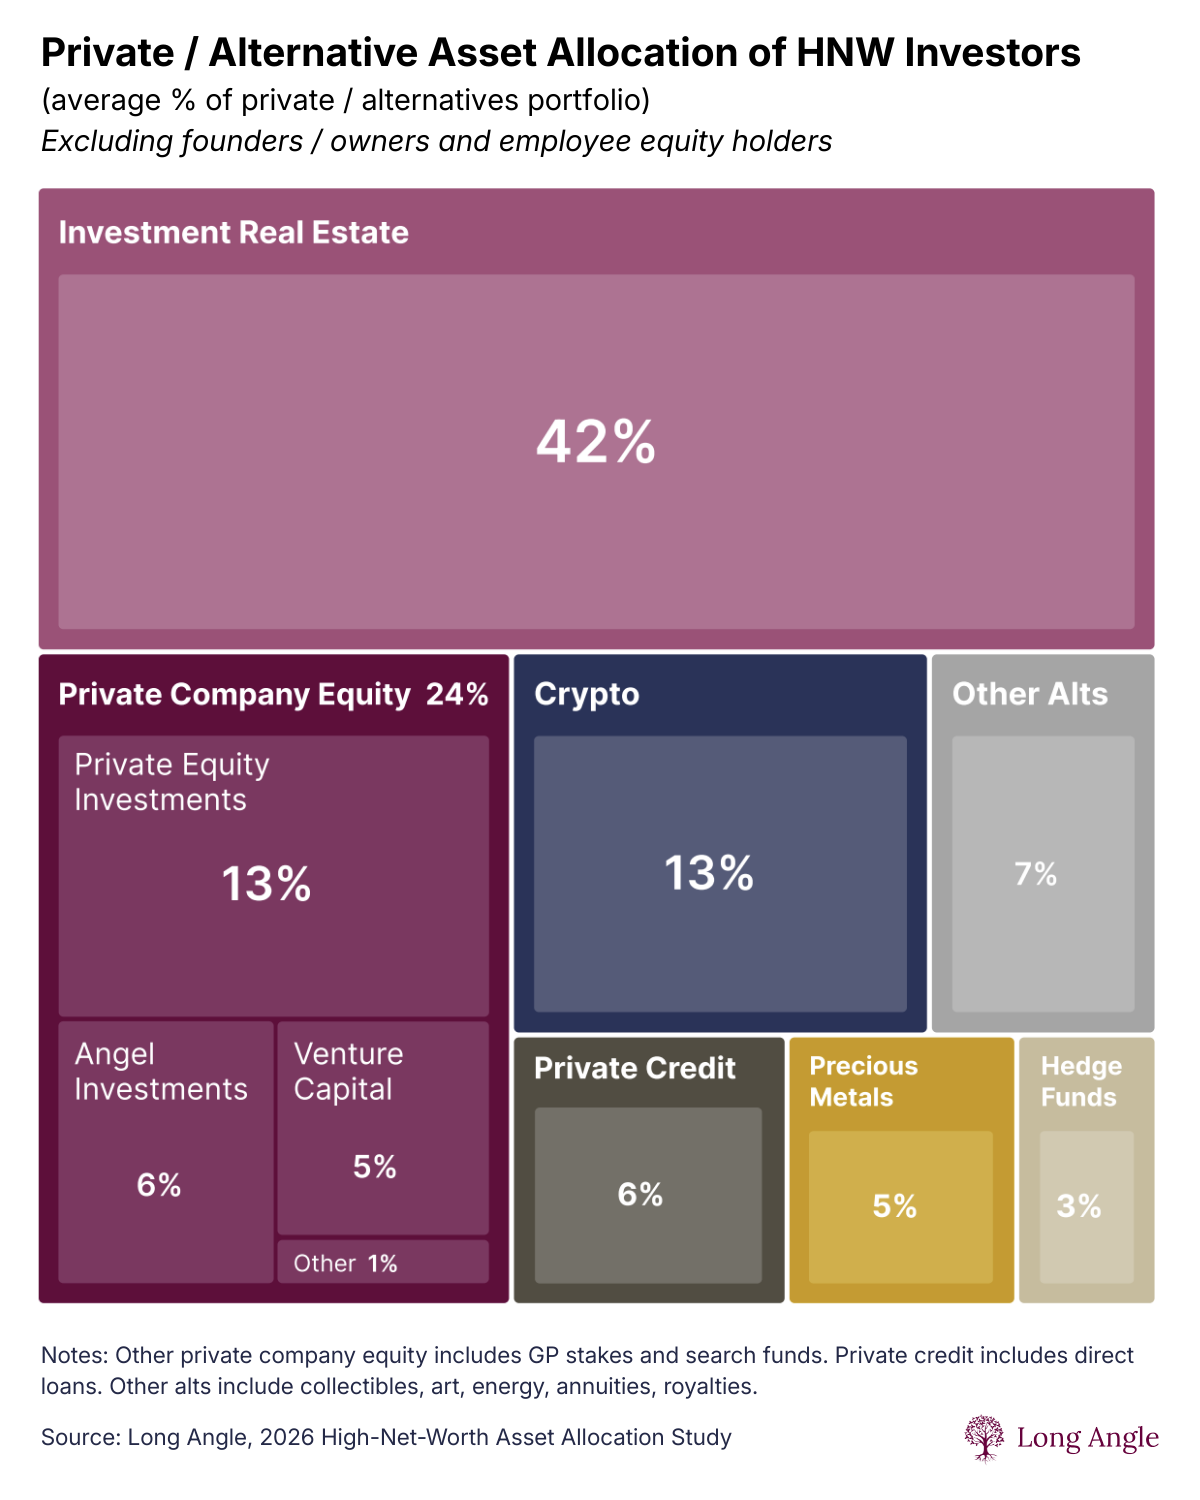
Excluding founders and owners with private company equity, the average high-net-worth private and alternatives portfolio breaks into three buckets: yield and cash flow (48%), upside potential (37%), and uncorrelated diversification (15%).
Yield and cash flow (48% combined). This is the largest objective, dominated by investment real estate at 42% of the private and alternative portfolio and supplemented by private credit at 6%.
Upside potential (37%). Private company equity at 24% and crypto at 13% are relied on for capital appreciation and asymmetric growth potential. The allocation to private company equity is currently 4x that of private credit, and crypto is more than double the allocation to precious metals.
Uncorrelated diversification (15%). Investors hedge against market volatility through precious metals, hedge funds, and alternatives like energy, royalties, and collectibles.
Investment real estate adoption is the highest of any alternative asset class at 64% of all respondents. Direct residential ownership is the dominant strategy at 38% adoption, more popular than real estate funds (25%) or REITs (14%). Directly owned non-residential property sits at 13%, suggesting an untapped opportunity for further diversification.
Concentration Risk Among Founders, Owners, and Employees with Equity
Founders and company owners hold 61% of their private and alternative portfolio in their own company. Private company employees with equity hold 67% — the highest single-asset concentration in the study.
This concentration is the central pre-liquidity planning challenge for entrepreneurs and operators at this wealth tier. It reflects the operator's edge that built the wealth but creates a portfolio construction problem that most advisors and most public benchmarks cannot help solve. Pre-liquidity decisions (timing of partial sales, structured liquidity, lending against concentrated positions, tax sequencing) determine how much of the paper concentration converts to durable wealth.
For Long Angle members navigating these decisions, the sudden wealth checklist covers the sequencing framework most members apply at and after the liquidity event.
Mortgage Rates and Debt Among High-Net-Worth Households
The average debt-to-assets ratio across all high-net-worth respondents is 8%. The ratio halves once net worth exceeds $10M, falling to 5% at $10M-$25M and 4% above $25M. At the $25M+ tier, debt is typically used as a tactical tool rather than a financial necessity.
One-third of high-net-worth households own their primary residence outright with no mortgage. Among those with a mortgage, the average rate is 3.4%, with 73% holding rates below 4% and 48% in the 2-3% range. This reflects the 2020-2022 refinancing window and represents a generational rate lock that materially affects portfolio construction decisions at this wealth tier.
Loan rates across debt types step up linearly: primary residence mortgages at 3.4%, investment real estate mortgages at 4.5%, portfolio lines of credit at 5.2%, and home equity lines of credit at 6.1%. Average primary residence values scale from $1.30M at $2M-$10M to $2.01M at $10M-$25M to $3.33M above $25M.
Frequently Asked Questions
What is the average asset allocation for high-net-worth investors?
The average high-net-worth investor holds 51% in public equities, 28% in private and alternative assets, 11% in home equity, 5% in bonds, and 5% in cash. Excluding home equity, the investable portfolio is 57% public equities, 31% private and alternative assets, and 12% bonds and cash. These figures come from Long Angle's 2026 report of 233 respondents with an average net worth of $17M.
How does asset allocation change between $5M and $25M+ in net worth?
Private and alternative allocations rise from 24% at $2M-$10M to 34% above $25M, driven primarily by private company equity. At $25M+, private company equity represents 21% of net worth — more than triple the 6% share at $2M-$10M. Public equities and home equity decline as private allocations climb.
Do high-net-worth investors still use the 60/40 portfolio?
No. The traditional 60/40 portfolio has shifted to 60-10-30 among high-net-worth investors: 60% public equities, 10% bonds and cash, 30% private and alternative investments. This exceeds the industry's newer 50-30-20 model. 94% of high-net-worth investors now allocate to private or alternative assets.
Do high-net-worth investors use financial advisors or self-manage?
57% of high-net-worth investors self-manage their portfolios. 43% use a financial advisor, but only 14% have an advisor managing most or all of their assets. Half of all respondents have no interest in using an advisor. Self-management is particularly common at higher net worth tiers where portfolio complexity increases.
What advisor AUM fees do high-net-worth investors pay?
Among the 43% of high-net-worth investors who use an advisor, 71% pay AUM-based fees that average 0.70%. Fees compress with wealth: 0.79% at $2M-$10M, 0.67% at $10M-$25M, and 0.58% above $25M. Two-thirds of advised clients pay below 1%, and the most common single bracket is 1.00%-1.24% at 31% of advised respondents.
What asset allocation do FIRE high-net-worth investors use?
Over a third of high-net-worth respondents identify with the FIRE movement (Financial Independence, Retire Early). FIRE investors hold the highest public equity concentration at 62% of the investable portfolio, signaling a risk-on growth strategy. They hold meaningfully less investment real estate than peers (8% vs the 12% portfolio average).
What mortgage rates do high-net-worth homeowners have?
The average mortgage rate for high-net-worth homeowners is 3.4%. 73% have rates below 4%, with the most common range being 2-3% (48% of mortgaged homeowners). One-third of high-net-worth households own their primary residence outright with no mortgage. The average debt-to-assets ratio across all respondents is just 8%.
About Long Angle
Long Angle is a private, vetted community for highly successful entrepreneurs, executives, and investors. The 8,000+ members, primarily self-made 30-55-year-olds with portfolios ranging from $5M to $100M, rely on Long Angle as a confidential, unbiased resource for knowledge sharing, relationship building, and accessing private markets.
The 2026 High-Net-Worth Asset Allocation Report draws on 233 community respondents with an average net worth of $17M. It is Long Angle's fifth annual benchmark study on asset allocation, examining how high-net-worth investors structure their portfolios across public equities, private and alternative assets, real estate, bonds, and cash.
Long Angle facilitates institutional-grade alternative investments with over $450 million in committed capital across more than 50 Special Purpose Vehicles, spanning private equity, venture capital, search funds, private credit, secondaries, and real estate. Members make independent investment decisions on a deal-by-deal basis with full transparency into the investment team's diligence process. The community is solicitation-free.
Membership is free but requires an interview with a current community member, as well as validation of investable assets. Apply for Membership »